Background
The amygdala is composed of a heterogeneous group of distinct nuclear and cortical structures engaged in a variety of behavioural functions that include the generation of emotional responses such as fear and anxiety and the formation of emotional memories. The computations needed to accomplish these functions occur within the topographically organised excitatory intra-amygdaloid circuitries that are in turn controlled by inhibitory neurones. In the present proposal we aim to identify the neural substrates involved in fear learning. To gain a full understanding of the integrative mechanisms involved in the processing of emotionally relevant sensory stimuli by the amygdala and in the formation of memories for emotionally arousing events, it is necessary to characterise fully the intrinsic properties of its constituent elements and the interaction with other relevant brain areas such as the hippocampus. To achieve this aim we associate in vivo tract tracing and recording techniques with immunocytochemical analysis for specific markers of distinct neuronal populations both at the light and electron microscopic level. Moreover, we investigate the molecular composition and subcellular distribution of GABAA receptors on the plasma membrane of amygdalar neurons. Using animal models of conditioned fear and extinction, we examine at high spatial resolution whether changes in expression of specific GABAA receptor subtypes in amygdala underlie these behaviours. Through these studies we will offer a window on the organizational principles of distinct synaptic and cellular interactions within the amygdala, hence contributing to clarify the neural substrates of fear and anxiety.
Fig. 1. Double immunofluorescence labelling for the vasoactive intestinal polypeptide (VIP, shown in red) and the metabotropic glutamate receptor 1 (mGlu1, shown in green) in the central nucleus of the amygdala. Fig. 2. Reconstruction of a recorded and filled neuron in the intercalated cell masses of the amygdala; five sections (60 mm thickness) have been collapsed into a two-dimensional view. Soma and dendrites are shown in red whereas the axon is drawn in blue. Fig. 3. Electron micrograph of a dendritic shaft (d) and axon terminals in the intercalated cell masses of the amygdala. In this pre-embedding immunocytochemical experiment, immunometal particles within the dendritic shaft depict the location of mGlu1 receptors, immunometal particles associated with the active zone of presynaptic boutons correspond to mGlu7a receptors, whereas the peroxidase reaction end-product identifies mGluR8a receptors.
 |
 |
|
Fig. 4
|
Fig. 5
|
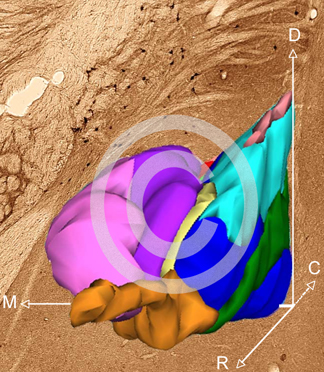
Fig. 4. 3D reconstruction of the intercalated cell masses (ITC) of the mouse amygdala; rostral half. The borders of the ITC clusters and of the main nuclei of the central and basolateral complexes of the amygdala were identified and outlined on stained mouse coronal serial sections. 3D reconstruction was carried out using the CAR program (kindely provided by Dr. K. Sätzler, University of Ulster).
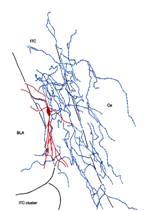
Fig. 5. Camera lucida reconstruction of an ITC neuron. After electrophysiological recording and filling with biocytine, the ITC neuron was revealed by ABC-HRP reaction. The bidimensional reconstruction of the soma and neurites by camera lucida revealed an unexpected axonal pattern.
 |
|
Fig. 6
|
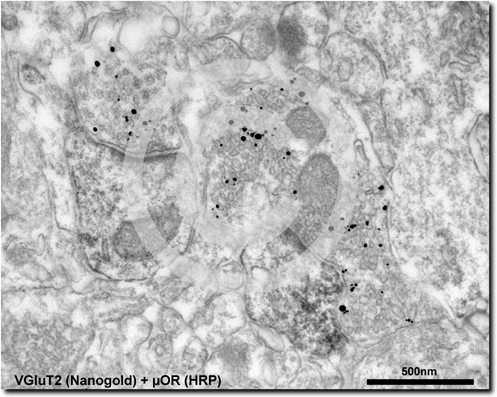
Fig. 6. Electron micrograph of a double pre embedding immunolocalization for the m opioid receptor (µOR) and vesicular glutamate transporter 2 (VGluT2) in the intercalated cell masses (ITC) of the amygdala. This micrograph shows two µOR-immunoreactive (IR) spines (visualized by the immunoperoxidase reaction) receiving asymmetrical synapses from VGluT2-IR presynaptic boutons (immunolabelling visualized by gold-silver reaction).
 |
|
Fig. 7
|
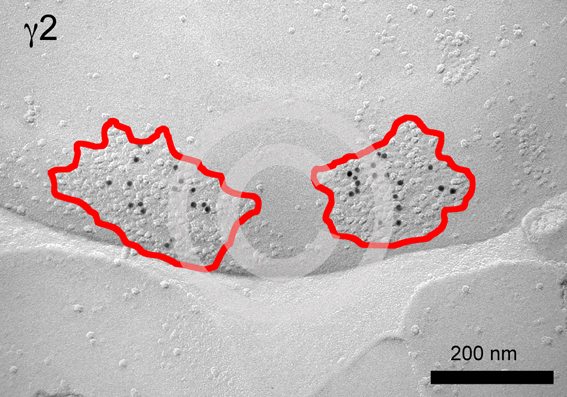
Fig. 7. SDS-freeze fracture replica immunogold labelling (FRL) for the g2 subunit of the GABAA receptor in the rat basolateral amygdala. Clusters of intra-membrane particles (IMPs) can be observed unevenly distributed on the protoplasmic face (P-face) of neurons, which are often labelled for GABAA receptor subunits, and therefore may represent GABAergic synapses. In this figure, two IMP clusters (surrounded by a red line) immunolabelled (black dots) for the GABAA g2 subunit are shown. |